Receptive has a large number of predefined reports that enable you to quickly and easily analyze your data, plus you can create your own customized report as well. It’s easy to see why the choice can be overwhelming.
With that in mind, we thought we’d share some ideas. Here are some reports that you’ve probably overlooked or hadn’t even thought of using, but that will provide amazing insights into your data once you start looking at them.
The Churned Customers Report
The Churned Customers Report does exactly what the name suggests - it shows you what your churned customers wanted most before they churned.
Now I know what you’re thinking… Why should we care what our churned users wanted? They’ve gone now!
Well here’s the thing, your churned users stopped using your product for a reason. Logically, it’s safe to assume that other users might churn in future for the same reasons. If you could figure out what those reasons were, maybe you could prevent future churn.
The Churned Customers Report will give you some of those reasons. Perhaps there was some sort of functionality that was crucial to the majority of those users that churned. If you could identify this deal-breaker and then add in that functionality, chances are you’ll prevent a lot of potential churn.
Not only that, but if you start working on some of the ideas that this report surfaces for you, then maybe some of these churned users will end up returning to your product. It’s a win-win.
The Prospect Report
A lot of SaaS companies often build everything their prospects want in an attempt to close more deals, but as a result they can end up ignoring what their customers want.
The Prospect Report is a really useful way of avoiding that problem. Before you decide to simply go ahead and build whatever your latest prospect asks for, you can use this report to see if it’s something that a lot of prospects want.
If only one prospect wants a particular feature, then it’s probably not worth the time and effort. Instead, you can focus on what the majority of your prospects want, helping you to close more deals.
The Prospect Report helps you to avoid knee-jerk reactions and to use data to guide your decision making.
The Effort-Value Chart
The Effort-Value Chart is a really great way of identifying quick wins that your Dev team can easily ship to improve your product with minimal effort.
As long as your Devs have been working through any requests and dialling in the effort they estimate they’ll take, then the chart will automatically update.
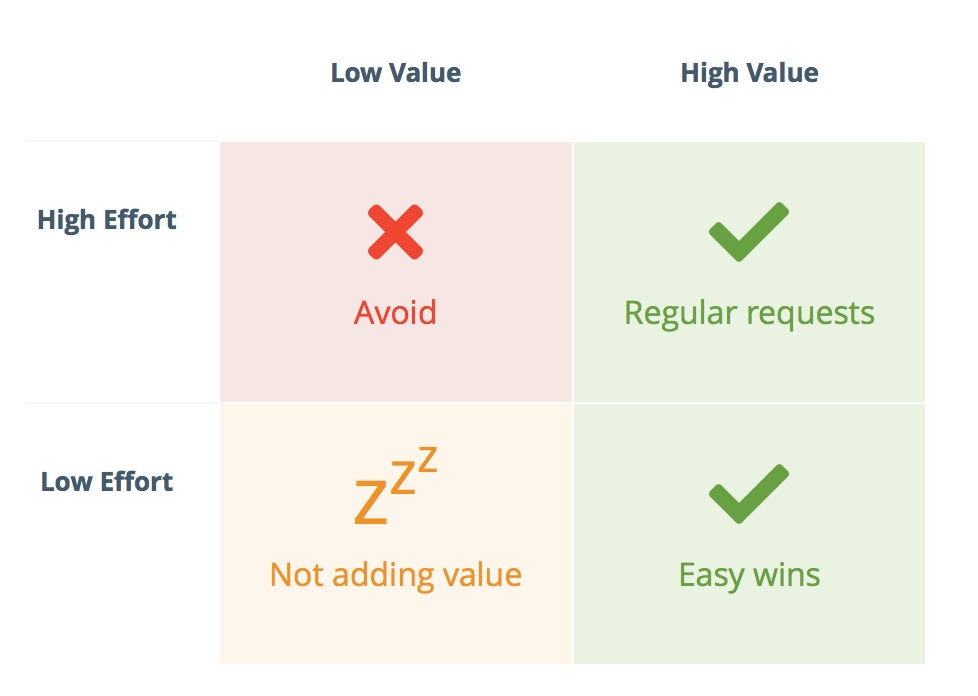
All you have to do is take a look at the chart, specifically the bottom-right quadrant, and you’ll see all the ideas that will provide the most value but take the least effort - or in other words, your quick wins.
This is great when you have some time freed up to make some quick improvements to your product.
The chart also shows you the ideas that won’t provide much value at all, yet will take the most time. Clearly, these are ideas that you might be better off avoiding.
The Departmental Wish List
This report is great for discovering what your team members want. I’ve called it The Departmental Wish List because, well, because that’s what it is. It’s a list of ideas that people in a specific department want the most.
For example, if you wanted to know which ideas and improvements your Success team wanted to see built, you could run this report and get a handy list.
You can run this report for your main departments, and your team members will be automatically categorized as such when they’re added to Receptive. You’ll be amazed how different each department’s highest priorities will be.
It’s also possible to delve into even more specific groups, depending on optional tags that you’ve set up.
The Leadership Report
There are times when it’s useful to know what your Leadership team wants the most. If their priorities align with those of your customers, then it’s an extra incentive to work on those ideas.
If Leadership doesn’t agree with your customers, then you have to ask yourself why that might be, and maybe it’s a sign that your product strategy isn’t quite right.
Either way, it’s useful data to include in your decision making, and running this report is a straightforward way of getting that data.
The “What My Customers Want” Report
This not-so-catchily titled report is extremely useful for CSMs who have been assigned to a certain group of customers.
It utilizes Receptive’s tagging feature. Simply tag your customers with your own tag, for example, “CS: Joe” and then you can filter your customer report with that tag.
This will show you specifically what your customers want, rather than seeing all of your company’s customers. You can then focus on helping your customers find workarounds while their ideas are worked on.
It’s a great way to narrow down the data into something more manageable.
The Location Report

Sometimes your organization will want to focus on a particular part of the world. It might be you want to expand your user base in Europe, for example. To do this, you need to find out what your European customers want the most, and what your European prospects want the most.
If you set up Receptive’s auto-tagging functionality, locations will be pulled in for you, so all you need to do is run a custom report with the location filter. This will then show you the most popular requests and highest priorities for a given location.
You can use this data to help focus your resources on improving the product for users based in that location.
Your Own Reports
Hopefully this has shown you that you can customize Receptive’s reporting to hone in on exactly the data you need. I’m sure you have plenty of good ideas of your own as well, so go forth and analyze.
The one thing you should remember is that it’s best to take a top-down approach. Rather than blindly creating reports for no reason, have a goal in mind. Then ask yourself what data you need to accomplish that goal. Then, and only then, should you look at the report.